

As online marketplaces capture the spotlight in the retail world, it is becoming increasingly important for retailers to monitor and measure the growth of their enterprises. While tracking marketplace metrics helps you ascertain the effectiveness of your strategy and enables you to pivot when required, it is imperative to track the right metrics that are aligned with your business goals.
In fact, 62% of retailers agree that they have created competitive advantages for their companies using relevant data. In this blog, we will discuss 15 key marketplace metrics that every growing retail enterprise should monitor. Keep reading to learn more.
Why are Metrics Important for Marketplaces?
Marketplace metrics are powerful tools that help you make data-driven business decisions by offering crucial insights into various essential aspects of retail marketplaces. Here are the different benefits of leveraging these metrics for your company:
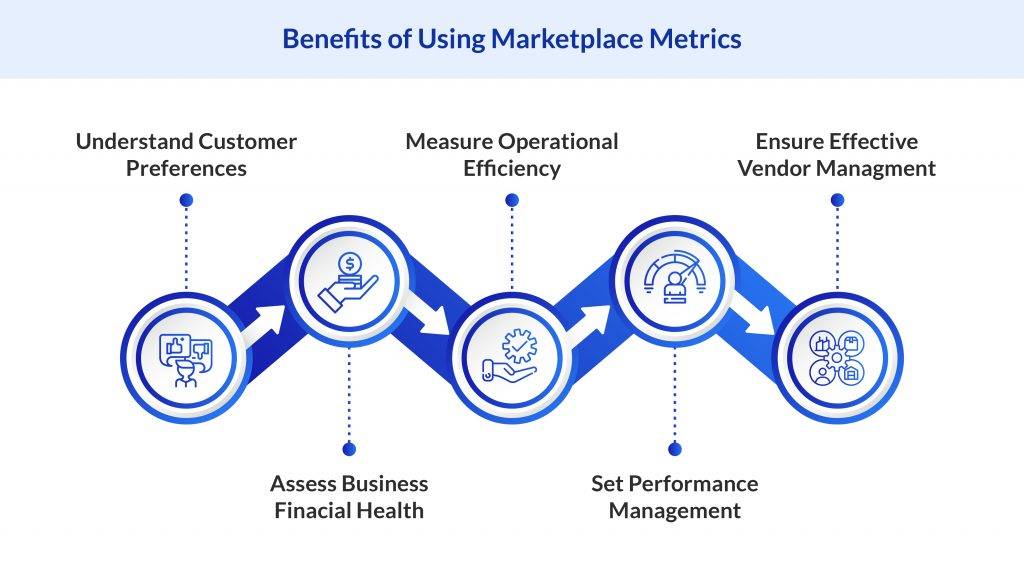
- Understanding Customer Preferences: Marketplace metrics can help you better understand customer preferences. By analyzing metrics like search patterns, purchase history, and product reviews, you will have a better understanding of customer preferences and then customize your products and services accordingly. This information can help you create strategies to improve customer satisfaction and boost sales volume.
- Assessing Financial Strength: Metrics such as Gross Merchandise Value (GMV), Net Revenue, and Profit Margin provide a clear picture of the financial health of your marketplace. These marketplace metrics can help you assess your financial strength and make informed decisions about future investments. Understanding your financial position can guide your strategic planning and ensure effective allocation of resources.
- Measuring Efficiency in Operations: Operational metrics like order fulfillment rate, delivery time, and return rate allow you to measure the efficiency of your operations. By monitoring these metrics, you can identify bottlenecks and take corrective actions, leading to improved operational performance, reduced costs, and increased customer satisfaction.
- Setting Performance Standards: Marketplace metrics like seller ratings, customer satisfaction scores, and Net Promoter Score (NPS) can serve as benchmarks for performance, helping you set standards and goals for your team. This can lead to improved marketplace performance, increased accountability, and a culture of continuous improvement.
- Effective Vendor Management: Vendor-related metrics like seller churn rate, average response time, and dispute resolution rate can help you manage your vendors effectively. These metrics can provide insights into vendor performance and satisfaction, helping you build strong relationships with your vendors.
15 Crucial Marketplace Metrics for Retailers
Here are 15 important marketplace metrics that you must monitor closely for your retail enterprise:
Gross Merchandise Value (GMV)
Gross Merchandise Value, or GMV, is a crucial marketplace metric that represents the total value of merchandise sold through the platform over a specific period. It measures the scale of your marketplace business and can provide insights into its overall health and growth.
GMV = Number of Transactions x Average Order Value
If your marketplace has 100 transactions in a month, with an average order value of $50, your GMV for that month would be $5,000.
By tracking GMV, you can understand the trends in total sales volume and identify the factors driving these trends. This can help you make informed decisions about product assortment, pricing strategies, and promotional activities.
Liquidity
Liquidity is another key metric for marketplaces. It measures the likelihood of transactions occurring on your platform. High liquidity indicates a healthy marketplace where buyers can find what they’re looking for and sellers can find buyers for their products.
Liquidity can be calculated both on the buyer side and the seller side.
- Seller Liquidity: This is the percentage of listings that result in transactions within a specific time period.
Seller Liquidity = Number of Listings with Transactions / Total Number of Listings
If your marketplace has 200 listings and 50 of them result in transactions within a month, your seller liquidity for that month would be 25%.
- Buyer Liquidity: This is the probability that a visit will turn into a transaction.
Buyer Liquidity = Number of Transactions / Number of Visits
If your marketplace has 1,000 visits and 100 of them result in transactions within a month, your buyer liquidity for that month would be 10%.
Monitoring liquidity can help you understand the balance between supply and demand on your platform. It can also offer actionable insights into user behavior and preferences. This will help optimize your strategies to boost customer engagement and increase transactions.
Take Rate
Take Rate is a significant marketplace metric that represents the percentage of the total transaction value that the marketplace retains as revenue. It is a direct indicator of the marketplace’s monetization efficiency.
Take Rate = Marketplace Revenue / Gross Merchandise Value
If your marketplace generates $20,000 in revenue from a GMV of $200,000, your take rate would be 10%.
A higher take rate can indicate a more profitable marketplace, but it is important to balance this with competitive pricing to ensure sellers and buyers continue to find value in your platform. It can also help identify trends and make projections about future revenue.
Net Revenue
Net Revenue is another crucial metric for retail marketplaces. Unlike GMV, which represents the total order value of transactions, Net Revenue is the amount the marketplace retains after deducting costs such as payment processing fees and returns. It is a more accurate reflection of the marketplace’s profitability. It is a key metric for stakeholders and investors as it directly reflects the marketplace’s bottom line.
Net Revenue = Gross Revenue – Cost of Goods Sold
If your marketplace has a gross revenue of $50,000 and the cost of goods sold is $10,000, your net revenue would be $40,000.
Tracking net revenue helps identify areas for cost optimization. It can also help in financial planning and forecasting, as well as in assessing the effectiveness of pricing strategies and promotional campaigns.
Active Users
Active users are a key marketplace metric that represents the number of users who have engaged with your platform within a specific time period. This could include actions such as browsing products, completing a payment, or adding select products to their online shopping cart.
You can calculate active users based on the following time frame:
- Daily Active Users (DAU): This represents the number of unique individuals engaging with your platform over the span of a single day.
- Weekly Active Users (WAU): Reflects the total number of unique users who interact with your platform throughout the week.
- Monthly Active Users (MAU): Indicates the total number of unique visitors engaging with your marketplace over a 30-day period.
Tracking the number of active users can help businesses understand their user engagement and growth. A constant increase in the total number of active users indicates that your marketplace is attracting and retaining users effectively. Conversely, a decline could signal issues with user experience, product offerings, or customer service that need to be addressed.
User Acquisition Cost (UAC)
User Acquisition Cost, or UAC, is the cost associated with convincing a potential user to use your product or service. You can calculate UAC by dividing the total amount spent on advertising and marketing by the total number of new users acquired.
UAC = Total Marketing and Advertising Costs / Number of New Users Acquired
If you spend $5,000 on marketing and advertising and acquire 500 new users, your UAC would be $10.
UAC is a crucial metric for scaling retail enterprises as it helps businesses understand the cost-effectiveness of their marketing strategies. By monitoring UAC, you can optimize your marketing spend, improve marketing strategies, and ultimately acquire new users more efficiently. A lower UAC indicates that you can acquire new users at a lower cost, which is crucial to ensure improved profitability in the long run.
Customer Lifetime Value (CLTV)
Customer Lifetime Value, or CLTV, estimates the total net profit that your marketplace can make from the total duration of the relationship with a customer. It is an important metric as it helps businesses understand the value each customer brings over their lifetime.
CLTV = (Average Purchase Value x Purchase Frequency) x Average Customer Lifespan
If a customer typically spends $50 per purchase, makes a purchase every month, and remains a customer for an average of 3 years, the CLTV would be $1,800.
By monitoring CLTV, you can recognize the most valuable customers and develop policies for their retention. This marketplace metric can also help you make decisions about customer acquisition spending.
Repeat Purchase Rate
Repeat Purchase Rate is a crucial marketplace metric in the competitive retail landscape. It measures the total percentage of customers who have shopped from your company more than once. It is a direct indicator of customer loyalty and satisfaction.
Repeat Purchase Rate = Number of Customers Who Have Shopped More Than Once / Total Number of Customers
If you have 200 customers and 50 of them, have made more than one purchase, your Repeat Purchase Rate would be 25%.
A high Repeat Purchase Rate is a sign that your customer base is satisfied with your marketplace and is willing to buy from you again. It can also provide insights into the effectiveness of your customer retention strategies. Monitoring this metric can help focus your efforts on improving customer loyalty and increasing customer lifetime value.
Seller Churn Rate
Seller Churn Rate is a crucial marketplace metric that measures the percentage of sellers who stop selling on your platform over a certain period. It is an important indicator of seller satisfaction and retention.
Seller Churn Rate = Number of Sellers Who Left / Total Number of Sellers
If you start with 100 sellers and 10 of them stop selling, your Seller Churn Rate would be 10%.
A high Seller Churn Rate could indicate issues with seller satisfaction, such as unfavorable marketplace policies or lack of support. By monitoring this metric, you can identify areas for improvement and implement strategies to increase seller retention.
Average Order Value (AOV)
Average Order Value, or AOV, is a key marketplace metric that measures the average total of every order placed over a certain period. It provides insights into customer spending habits.
AOV = Total Revenue / Number of Orders
If your total revenue is $5,000 and 200 orders were placed, your AOV would be $25.
By tracking AOV, you can understand how much customers typically spend on each order. This can inform pricing strategies, marketing campaigns, and promotional offers. Increasing AOV is a strategic way to increase revenue without having to acquire new customers.
Conversion Rate
The conversion rate, a key metric, calculates the proportion of visitors executing a specific action (such as a purchase) on your platform. This indicator directly reflects the success of your platform and marketing approaches.
Conversion Rate = Number of Conversions / Number of Total Visitors
If your marketplace has 1,000 visitors and 100 of them make a purchase, your Conversion Rate would be 10%.
By tracking the conversion rate, you will be in a better position to learn how well your platform engages visitors and prompts them to make a purchase. This can help make strategic decisions about website design, product offerings, and marketing strategies.
Order Fulfillment Rate
Order Fulfillment Rate is a crucial metric for scaling retail enterprises. It measures the percentage of orders that are successfully fulfilled without being canceled or returned.
Order Fulfillment Rate = Number of Orders Fulfilled / Number of Orders Received
If your marketplace receives 200 orders and fulfills 180 of them, your Order Fulfillment Rate would be 90%.
Tracking the Order Fulfillment Rate can provide insights into the efficiency of your operations. A high Order Fulfillment Rate indicates that your marketplace can efficiently process and deliver orders, which can help you ensure improved customer satisfaction levels and gain repeat business from those consumers. Conversely, a low rate could signal issues with inventory management, supplier reliability, or order processing that need to be addressed.
Return Rate
The Return Rate calculates the percentage of products sold that are later returned by customers. It is one of the most important marketplace metrics that offer insights into product quality and customer satisfaction.
Return Rate = Number of Products Returned / Number of Products Sold
If your marketplace sells 1,000 products and 50 of them are returned, your Return Rate would be 5%.
A high Return Rate could indicate issues with product quality, inaccurate product descriptions, or poor delivery services. By tracking the Return Rate, you can identify these issues and take corrective actions to improve product quality and customer satisfaction.
Customer Support Tickets
Customer Support Tickets are a significant metric for marketplaces. They represent the number of customer queries or complaints received by your customer support team.
Tracking the number of Customer Support Tickets can help you understand customer issues and improve your support services. A sudden increase in tickets could indicate a problem with a product or service, while a decrease could signal an improvement in product quality or customer experience.
Monitoring this metric will help your enterprise focus efforts on improving customer service, resolving issues promptly, and ultimately enhancing customer satisfaction and loyalty.
Net Promoter Score (NPS)
Net Promoter Score, or NPS, is one of the crucial marketplace metrics. It measures customer satisfaction and loyalty by asking customers a simple question: ‘On a scale of 0-10, how likely are you to recommend our company/product/service to a friend or colleague?’
The responses are then used to classify customers into three categories:
- Promoters (score 9-10): These are loyal enthusiasts who will keep buying and referring others.
- Passives (score 7-8): They are satisfied but unenthusiastic customers who might be attracted to offerings from the competitors.
- Detractors (score 0-6): They are unhappy customers who are not satisfied with your brand and can damage your enterprise through negative word-of-mouth.
NPS = % Promoters – % Detractors
If 50% of respondents were Promoters, 20% were Passives, and 30% were Detractors, your NPS would be 20 (50% – 30%).
NPS offers crucial insights into customer loyalty and satisfaction to help identify areas for improvement. A high NPS indicates that customers are satisfied with your marketplace and are likely to endorse it to others. This can help with your customer acquisition and retention efforts. Conversely, a low NPS could signal issues with customer satisfaction that need to be addressed.
Optimize Your Retail Marketplace with Flipkart Commerce Cloud (FCC)
Regularly tracking marketplace metrics offers valuable insights into your company’s performance and growth trajectory. This strategy empowers you to optimize your marketing strategies and stay ahead of the competition. To make the most of data from these metrics, leverage a robust retail platform like Flipkart Commerce Cloud (FCC).
FCC provides a suite of services designed to help retailers with their online stores. Solutions like FCC Ads Manager, FCC Pricing Manager, and FCC Selection Manager maximize the growth potential of your platform. Tech-driven solutions from FCC ensure that your retail data aligns seamlessly with advanced technological frameworks, ensuring smooth transactions while maintaining strict data privacy.
So, why wait? Start tracking your marketplace metrics today and unlock new growth opportunities with FCC. Connect with our team of experts now.