

For any business to thrive and grow, efficient pricing is often one of the most important aspects that retailers need to manage. The price tag you attach to the products can significantly impact your bottom line, affecting revenues and profit margins. However, without a robust system to track and monitor pricing Key Performance Indicators (KPIs), even the most well-planned strategies might fail to meet their objectives.
Pricing KPIs help you identify pricing methods that are yielding desired results and pinpoint areas that need fine-tuning. This approach allows you to make data-driven decisions and optimize pricing for the evolving market.
In this article, we will explore the importance of pricing KPIs for retailers along with essential metrics that you should track and how to implement and monitor them effectively.
Pricing KPIs: What Are They?
Pricing KPIs are quantifiable measures that provide a performance snapshot of your pricing strategies. They serve as a critical tool for retailers to evaluate and optimize their pricing decisions. These KPIs are essential for different stakeholders within a retail enterprise.
For instance, product managers can use these metrics to set competitive prices for their products. Sales teams can leverage them to negotiate deals that align with the company’s pricing strategy. Finance teams can use them to forecast revenue and profitability.
Let’s take the Average Selling Price (ASP) as an example. This KPI provides the average price at which your products are sold over a specific period. By tracking the ASP, you can identify pricing trends, assess the efficiency of your pricing strategies, and make necessary adjustments.
Importance of KPIs in Product Pricing Strategy
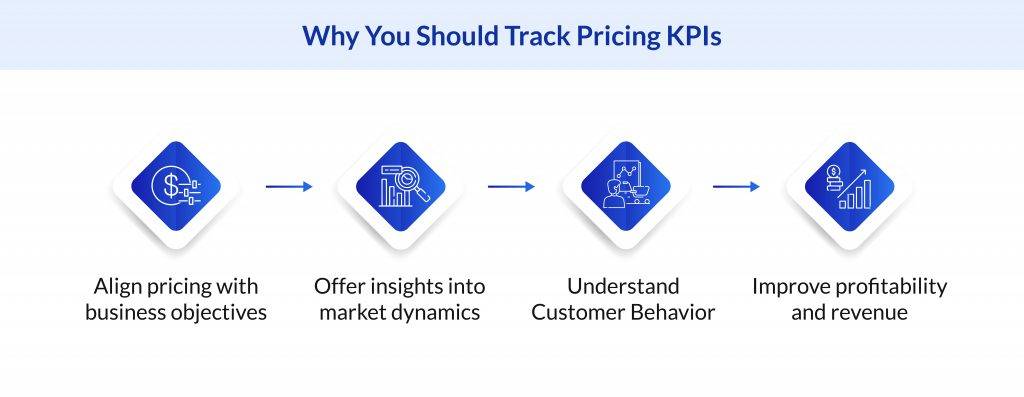
Here is how tracking pricing KPIs can help your enterprise:
- Pricing KPIs help align pricing decisions with your business goals. They provide a clear direction and help maintain focus on what matters most to your business.
- Pricing KPIs offer actionable insights into market trends and the competitive landscape. They help you understand where you stand in the market and how your pricing strategy compares to your competitors.
- Pricing KPIs can reveal how customers respond to your pricing decisions. This can assist you with customizing your pricing strategy to meet their expectations.
- Tracking pricing KPIs, like profit margin and average selling price, helps ensure that your pricing decisions contribute to the bottom line and enhance profitability.
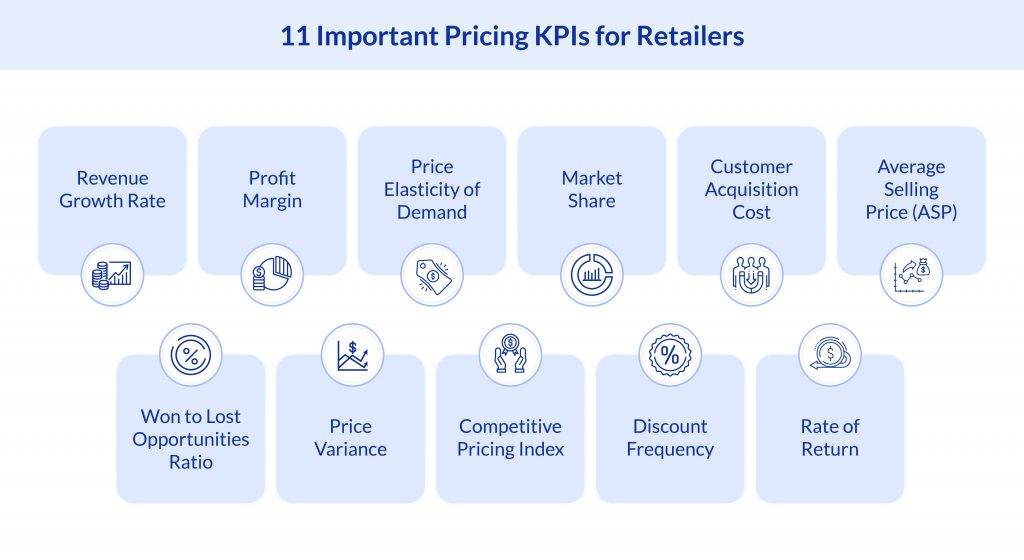
Essential KPIs for Effective Product Pricing Strategy
Here are the important KPIs that you should monitor to develop effective product pricing strategies:
Revenue Growth Rate
The revenue growth rate is an important pricing KPI that defines the percentage increase in your revenue over a given period. It is calculated using the formula:
Revenue Growth Rate = (Current Revenue − Previous Revenue) × 100 / Previous Revenue
By monitoring this metric, you can assess the efficiency of your pricing strategy, identify any potential gaps, and make strategic adjustments as needed.
One approach to enhance your revenue growth rate is by diversifying your product portfolio. By introducing new products, you can broaden your revenue sources and draw in a higher number of new customers. Implementing promotions or discounts can also incentivize customers to buy more frequently or in larger volumes, thereby boosting your revenue growth rate.
Profit Margin
The profit margin determines the profitability of your product. You can use the following formula to calculate it:
Profit Margin = Total Revenue (Total Revenue − Cost of Goods Sold) × 100
This KPI allows you to evaluate the success of your pricing strategy and make data-driven decisions to bolster profitability.
To enhance your gross margin, you should consider optimizing your costs. This could involve negotiating with vendors for lower costs, refining your buying and selling process to minimize inefficiencies, or outsourcing certain tasks to cut labor costs. If you notice that your profit margins are consistently low, you may consider raising your prices.
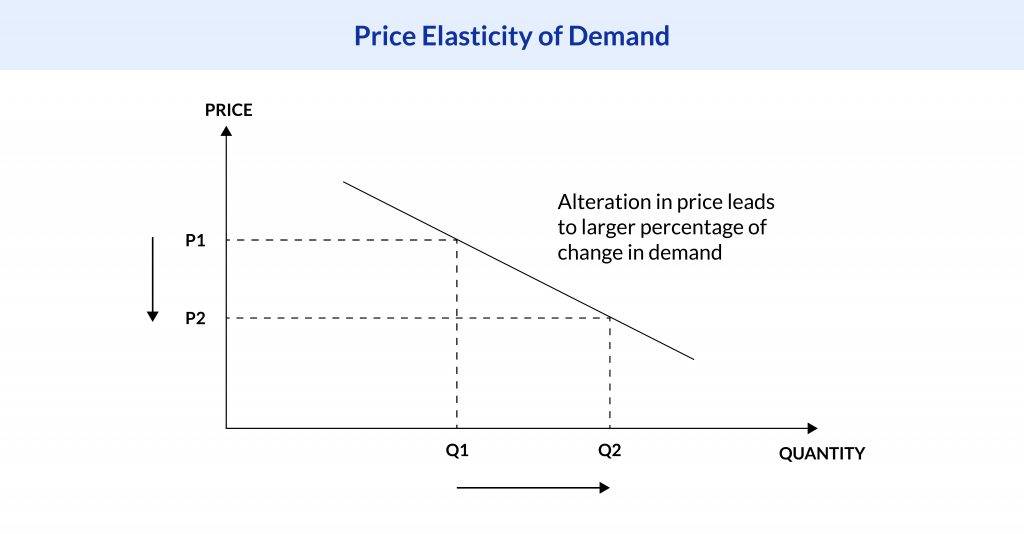
Price Elasticity of Demand
Knowing a product’s price elasticity of demand is essential to determine the customer’s responses to price changes. This pricing KPI is calculated using the following formula:
Price Elasticity of Demand = % Change in Quantity Demanded / % Change in Price
It determines the degree of responsiveness of the quantity demanded to a change in price. A higher price elasticity indicates that customers are sensitive to price changes, while a lower price elasticity suggests that price changes have little impact on demand. You can tailor your pricing strategy to optimize profits through two distinct methods:
- For products with elastic demand, the strategy is to lower prices to boost sales volumes. This approach can enhance your position in the market and increase the perceived value of your offerings.
- On the other hand, for inelastic products, a shift towards higher prices can be used to boost profit margins with minimal impact on the volume of units sold. This strategy focuses on revenue maximization and protects the product’s market presence.
Market Share
Market Share is a KPI that quantifies the percentage of your total market sales that can be attributed to your product/company. The market share is calculated using this formula:
Market Share = (Company’s Total Sales × 100) / Total Market Sales
A high market share indicates a strong market presence, while a low market share may suggest a need for strategic adjustments.
Monitoring this KPI helps you assess your product’s performance relative to your competitors, determine your product’s influence on the industry, and fine-tune your pricing strategy accordingly.
To enhance your market share, you might consider expanding your distribution channels or investing in marketing initiatives to improve brand awareness. You can analyze your competitors’ pricing strategies and modify your own as needed to stay competitive.
Customer Acquisition Cost
The Customer Acquisition Cost (CAC) defines the total cost of acquiring a new customer. You can use the following formula to calculate CAC:
Customer Acquisition cost = Total Marketing and Sales Expenses / New Customers Acquired
By tracking this KPI, you can assess the efficiency of your marketing efforts, identify potential areas for improvement, and fine-tune your pricing strategy to ensure alignment with your business goals.
To lower your CAC, you might consider investing in targeted marketing campaigns that zero in on your ideal customer demographic. Optimizing your pricing strategy to encourage customer referrals can help reduce your CAC over time.
Average Selling Price (ASP)
The Average Selling Price (ASP) is a good KPI that presents a snapshot of the average price at which a product is sold over a specific period. The formula for calculating ASP is:
Average Selling Price = Total Revenue / Total Number of Units Sold
By monitoring the ASP, you can get a clear understanding of your products’ price positioning in the market.
If the ASP decreases, this might suggest an increase in discounts or a tendency to sell items at cheaper prices. While this may boost sales volume in the short term, it could negatively impact profitability in the long run.
On the other hand, a rising ASP could indicate that you are able to sell products at a higher price. However, if your sales volume declines with a rising ASP, this could suggest that prices are too high and are discouraging potential customers.
To optimize your ASP, consider using strategic seasonal discounts instead of frequent discounts. You should also work on lowering your costs by negotiating with suppliers to get the best deals.
Won Opportunities to Lost Opportunities Ratio
It is one of the crucial pricing KPIs that measures the ratio of successful sales opportunities to those that were not successful. You can calculate this ratio with the following formula:
Won Opportunities to Lost Opportunities Ratio =
Number of Lost Opportunities / Number of Won Opportunities
By tracking this KPI, you can assess the efficiency of your pricing strategies in converting sales opportunities. A high ratio indicates that your pricing strategies are effective in winning sales opportunities, while a low ratio might suggest a need for pricing adjustments.
To optimize this metric, you must refine your pricing strategies to better align with customer expectations and market trends. Additionally, investing in sales training and tools can help you improve the conversion of sales opportunities.
Price Variance
Price Variance calculates the gap between the actual price and the standard or expected price of your product. The formula to calculate price variance is:
Price Variance = Actual Price − Standard Price
Tracking this KPI can provide insights into how your actual pricing compares to your pricing goals or market expectations. A positive price variance indicates that your actual price is higher than the standard price, which could suggest higher profitability but might also impact sales volume. Conversely, a negative price variance might indicate lower profitability but potentially higher sales volume.
You can optimize this metric by regularly reviewing your pricing strategies and making necessary adjustments based on market trends, cost changes, and customer feedback.
Competitive Pricing Index
The competitive pricing index measures your product’s price relative to your competitors’ prices. It is calculated using the formula:
Competitive Pricing Index = (Your Product’s Price × 100) / Average Competitor Price
By tracking this KPI, you can analyze how competitively your products are priced in the market. A competitive pricing index greater than 100 indicates that your product is priced higher than the average competitor price, while an index less than 100 suggests that your product is priced lower.
To optimize this KPI, you can conduct regular market research to stay updated on competitor pricing and adjust your pricing strategies accordingly. Additionally, offering unique value propositions with your products can justify a higher price point and improve the competitive pricing index.
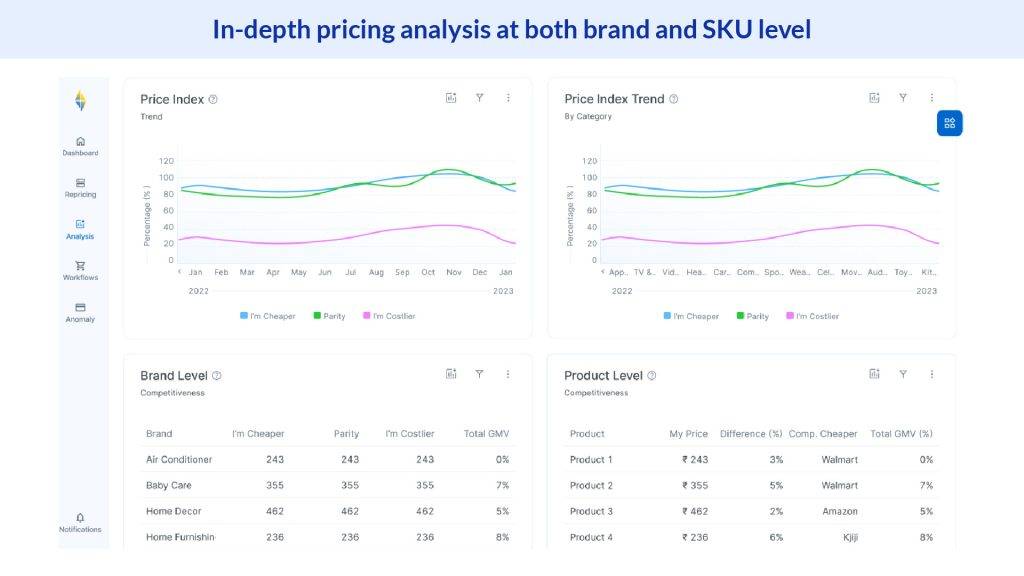
To further enhance your strategy, you can leverage competitor pricing solutions from Flipkart Commerce Cloud (FCC) and avail benefits like:
Accurate Product Matching: FCC provides a 99% accuracy rate for matching and comparing your products with similar or exact competitor products across channels and geographies.
Scaled Scraping of Competition: FCC’s best-in-class algorithm scrapes any competitive pricing data across all retail channels, scraping millions of SKUs at a time.
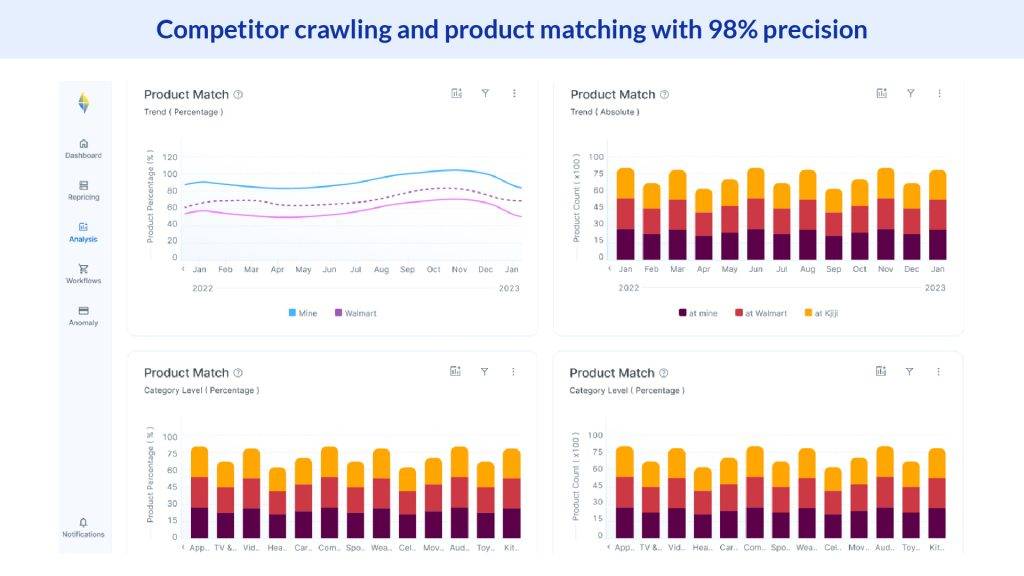
- Custom and Frequent Refresh Rates: With FCC, you can schedule and customize the refresh rates to scrape competitive data at frequency rates, starting from minutes to weeks.
- Competitive Analysis: FCC provides a custom solution for tracking competitors and helps you analyze the competitive landscape by category, brand, or any other breakdown that suits your needs.
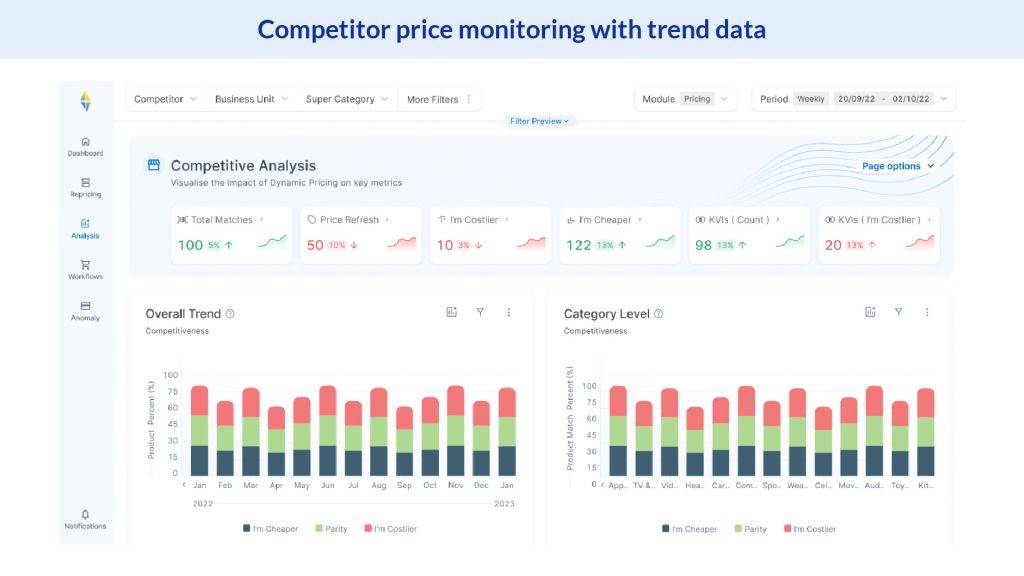
By leveraging these features, you can keep a pulse on the market, understand how your products are priced relative to your competitors, and make informed decisions to optimize your pricing strategies.
Discount Frequency
The discount frequency is another important pricing KPI that quantifies how often discounts are offered on your products. You can use the following formula to calculate this metric:
Discount Frequency = Number of Times Discounts Offered × 100 / Total Number of Sales
Tracking this KPI can provide insights into your discounting practices and their impact on sales and profitability. A high discount frequency might boost sales volume but could also erode profit margins.
You can optimize this metric by implementing strategic discounting practices. This could involve offering discounts during off-peak seasons to boost sales or providing volume discounts to encourage larger purchases
Rate of Return
The rate of return is an important pricing KPI that calculates investment profitability. It is calculated using the formula:
Rate of Return = (Gain from Investment − Cost of Investment) × 100 / Cost of Investment
By tracking this KPI, you can assess the financial return on your pricing strategies. A high rate of return indicates that your pricing decisions are yielding substantial profits, while a low rate of return might suggest a need for pricing adjustments.
Interestingly, the rate of return can often correlate with high pricing. If your products offer unique value or superior quality, users might be willing to pay a premium price, leading to a higher rate of return.
To optimize this metric, you need to refine your value proposition to justify higher prices. Additionally, conducting regular market research can help you stay updated on what customers are willing to pay and adjust your pricing strategies accordingly.
Best Practices for Implementing KPIs in Your Product Pricing Strategy
Here are the best practices to help you navigate this process:
- Define Clear Objectives: What do you want to achieve with your pricing strategy? Are you aiming for increased sales, higher profit margins, or market penetration? By defining clear and specific goals, you can align your pricing KPIs with your business objectives and ensure that they are driving the desired outcomes.
- Regular Monitoring and Analysis: Consistent monitoring and analysis involves regularly checking your KPIs to identify trends, patterns, and anomalies. Regular analysis allows you to understand the impact of your pricing strategy on your business performance and make necessary adjustments. Tools such as Google Analytics can play an important role in this process, providing real-time data and insights.
- Data-Driven Decision-Making: Use your pricing KPIs to inform your pricing decisions. This means analyzing your KPI data to understand what’s working and what’s not and then using this information to make informed pricing decisions. Utilize tools like Excel Spreadsheets or Business Intelligence tools to collect, analyze, and visualize data efficiently for informed decision-making.
- Adaptability and Flexibility: The market is constantly changing, and so should your pricing strategy. Be ready to adapt your pricing KPIs as market conditions change. This might mean adjusting your prices in response to changes in demand, competition, or costs. A flexible pricing strategy allows you to respond promptly to changes in the market and maintain your competitive edge.
- Collaboration and Communication: Implementing and tracking pricing KPIs is not a one-person job. It requires collaboration and communication across different teams, like sales, marketing, and finance teams. Ensure that everyone involved understands the pricing KPIs and how they contribute to the overall business objectives. Ongoing communication helps bring everyone on the same page and work toward common goals.
Role of Product Managers in Pricing Strategy
Product managers are responsible for the development, implementation, and monitoring of a product’s pricing strategy. By working in collaboration with sales, marketing, and finance teams, they gather data, analyze the market, and continuously fine-tune the pricing strategy to meet business objectives.
Beyond tracking KPIs, product managers need to stay current with industry trends, consumer behavior, and competitor pricing strategies. This involves conducting market research, participating in industry conferences, and interacting with industry experts and thought leaders.
The success of a product pricing strategy depends on a combination of data-driven decision-making, market research, and a deep understanding of the target audience. By defining clear KPIs and encouraging collaboration within teams, product managers can craft a pricing strategy that optimizes profitability and drives growth.
Conclusion
Successful pricing strategies go beyond determining the ideal price point. It is about driving brand recognition and laying the groundwork for business growth. In the world of retail, pricing KPIs serve as strategic tools, providing valuable insights that drive informed decision-making. To unlock the true potential of pricing KPIs, you need to leverage the best pricing software from Flipkart Commerce Cloud (FCC).
FCC Pricing Manager helps retailers automate their pricing decisions. It leverages AI-based price optimization models, built and improved over 14+ years, and used by Flipkart and dozens of leading retailers and brands worldwide.
The FCC Pricing Manager includes features like rule-based Dynamic Pricing Engine, Pricing Optimizer, and Competitive Intelligence, a tool for tracking any competitor at scale. These features, combined with game theory and the ability to manage micro parameters for macro impact on business, make the FCC Pricing Manager a valuable asset for retailers like you who want to optimize their pricing strategies.
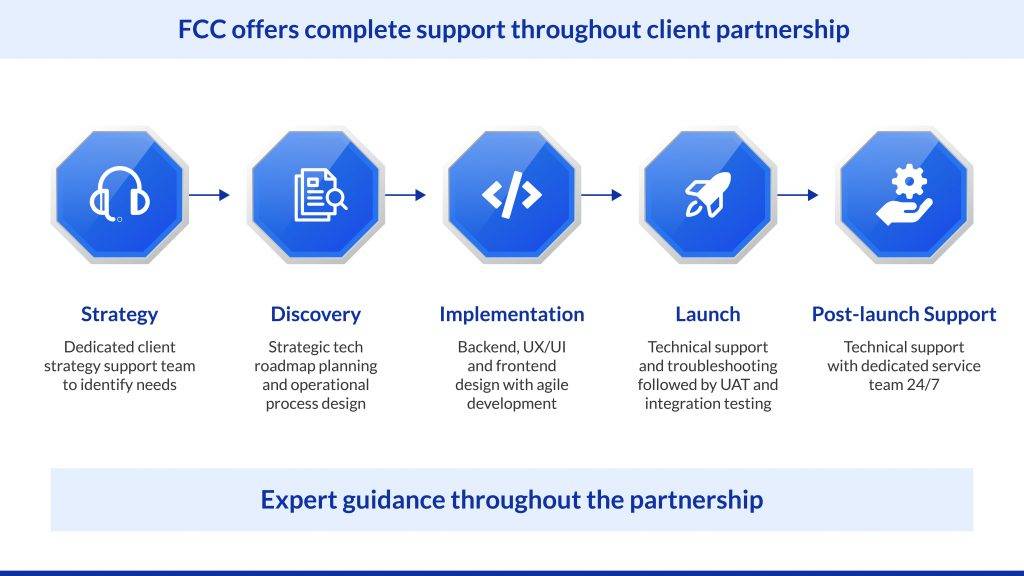
Apart from a highly configurable pricing platform, FCC also offers expert consultation throughout the partnership journey. We understand small changes in pricing can translate to considerable changes in revenue and profit, and the best way to ensure sustainable business growth for our clients is when granular pricing analytics is combined with expert insights.
That’s why our retail pricing specialists, with decades of experience in the field, collaborate closely with our clients to understand what needs to be done. By combining result-oriented strategies with an enterprise-level, easy-to-use platform for frontline managers, we help our clients build effective pricing strategies and unlock new pricing opportunities for sustainable business growth.
With support from FCC’s technology solutions and expert consultation, our clients have seen a 5-10% revenue uplift and a 7-15% margin improvement.
Interested to know how we can help you improve your product pricing game? Schedule a free demo with our retail pricing experts today!