
April 7, 2025
What is Inventory Turnover?
Inventory turnover measures the frequency at which a business sells and replaces its inventory within a specific timeframe, typically a year. This ratio is vital for assessing a company’s operational efficiency and financial health.
Drishti, Manager - Digital Marketing
Table of Contents
- What is Inventory Turnover?
- How Inventory Turnover Works
- How to Calculate Inventory Turnover
- High vs. Low Inventory Turnover
- How to Improve Inventory Turnover
- What is the Relation Between Inventory Turnover and Cash Conversion Cycle?
- Manage Your Inventory Effortlessly with FCC
What is Inventory Turnover?
Inventory turnover serves as a key performance indicator in retail and inventory management, reflecting the efficiency of a company’s stock movement. This metric reveals how quickly a business converts its inventory into sales, providing crucial insights into supply chain management and consumer demand.
A high inventory turnover suggests rapid sales and efficient operations, while a lower inventory turnover may indicate inadequate inventory management. By analyzing this ratio on the balance sheet, companies can optimize their purchase orders, pricing strategies, and overall inventory system.
Inventory turnover also plays a vital role in financial analysis, as it directly impacts a company’s cash flow and profitability. Understanding and optimizing this metric can lead to improved operational efficiency and enhanced competitiveness in the retail sector.
How Inventory Turnover Works?
Inventory turnover functions as a vital indicator of a company’s operational efficiency and market performance. It measures how quickly a business sells its stock and replenishes it with new inventory. This metric is calculated by dividing the cost of goods sold (COGS) by the average inventory value over a given period of time, typically a year.
A high inventory turnover rate suggests that products are selling quickly, indicating strong demand and efficient stock management. For example, an e-commerce fashion retailer selling trendy clothing items would aim for a high turnover to keep up with rapidly changing fashion trends and minimize the risk of dead stock. Conversely, a low turnover might indicate overstocking or weak sales but could be intentional for businesses dealing with high-value items or long lead times, such as an online store specializing in artisanal products.
By analyzing inventory turnover, businesses can optimize their supply chain, adjust pricing strategies, and improve cash flow. It also helps identify slow-moving items that tie up capital and storage space, allowing for more informed decisions on product mix and promotional activities. This metric also serves as a valuable benchmarking tool, enabling companies to compare their performance against industry standards and competitors.
How to Calculate Inventory Turnover?
Here are the different methods available to calculate inventory turnover:
Cost of Goods Sold Method
The Cost of Goods Sold (COGS) method provides the most accurate calculation of inventory turnover. This inventory turnover formula directly reflects how often inventory is replaced at cost, offering a clear picture of operational efficiency.
Inventory Turnover =Total Cost of Goods Sold / Average Inventory
This method is beneficial for businesses with varying profit margins across their product range. It provides a more precise measure of how quickly inventory moves through your company.
Example: An e-commerce store has an annual COGS of $500,000 and an average inventory balance of $100,000. Its inventory turnover ratio is 5, meaning it has sold and replaced its entire inventory five times over the year.
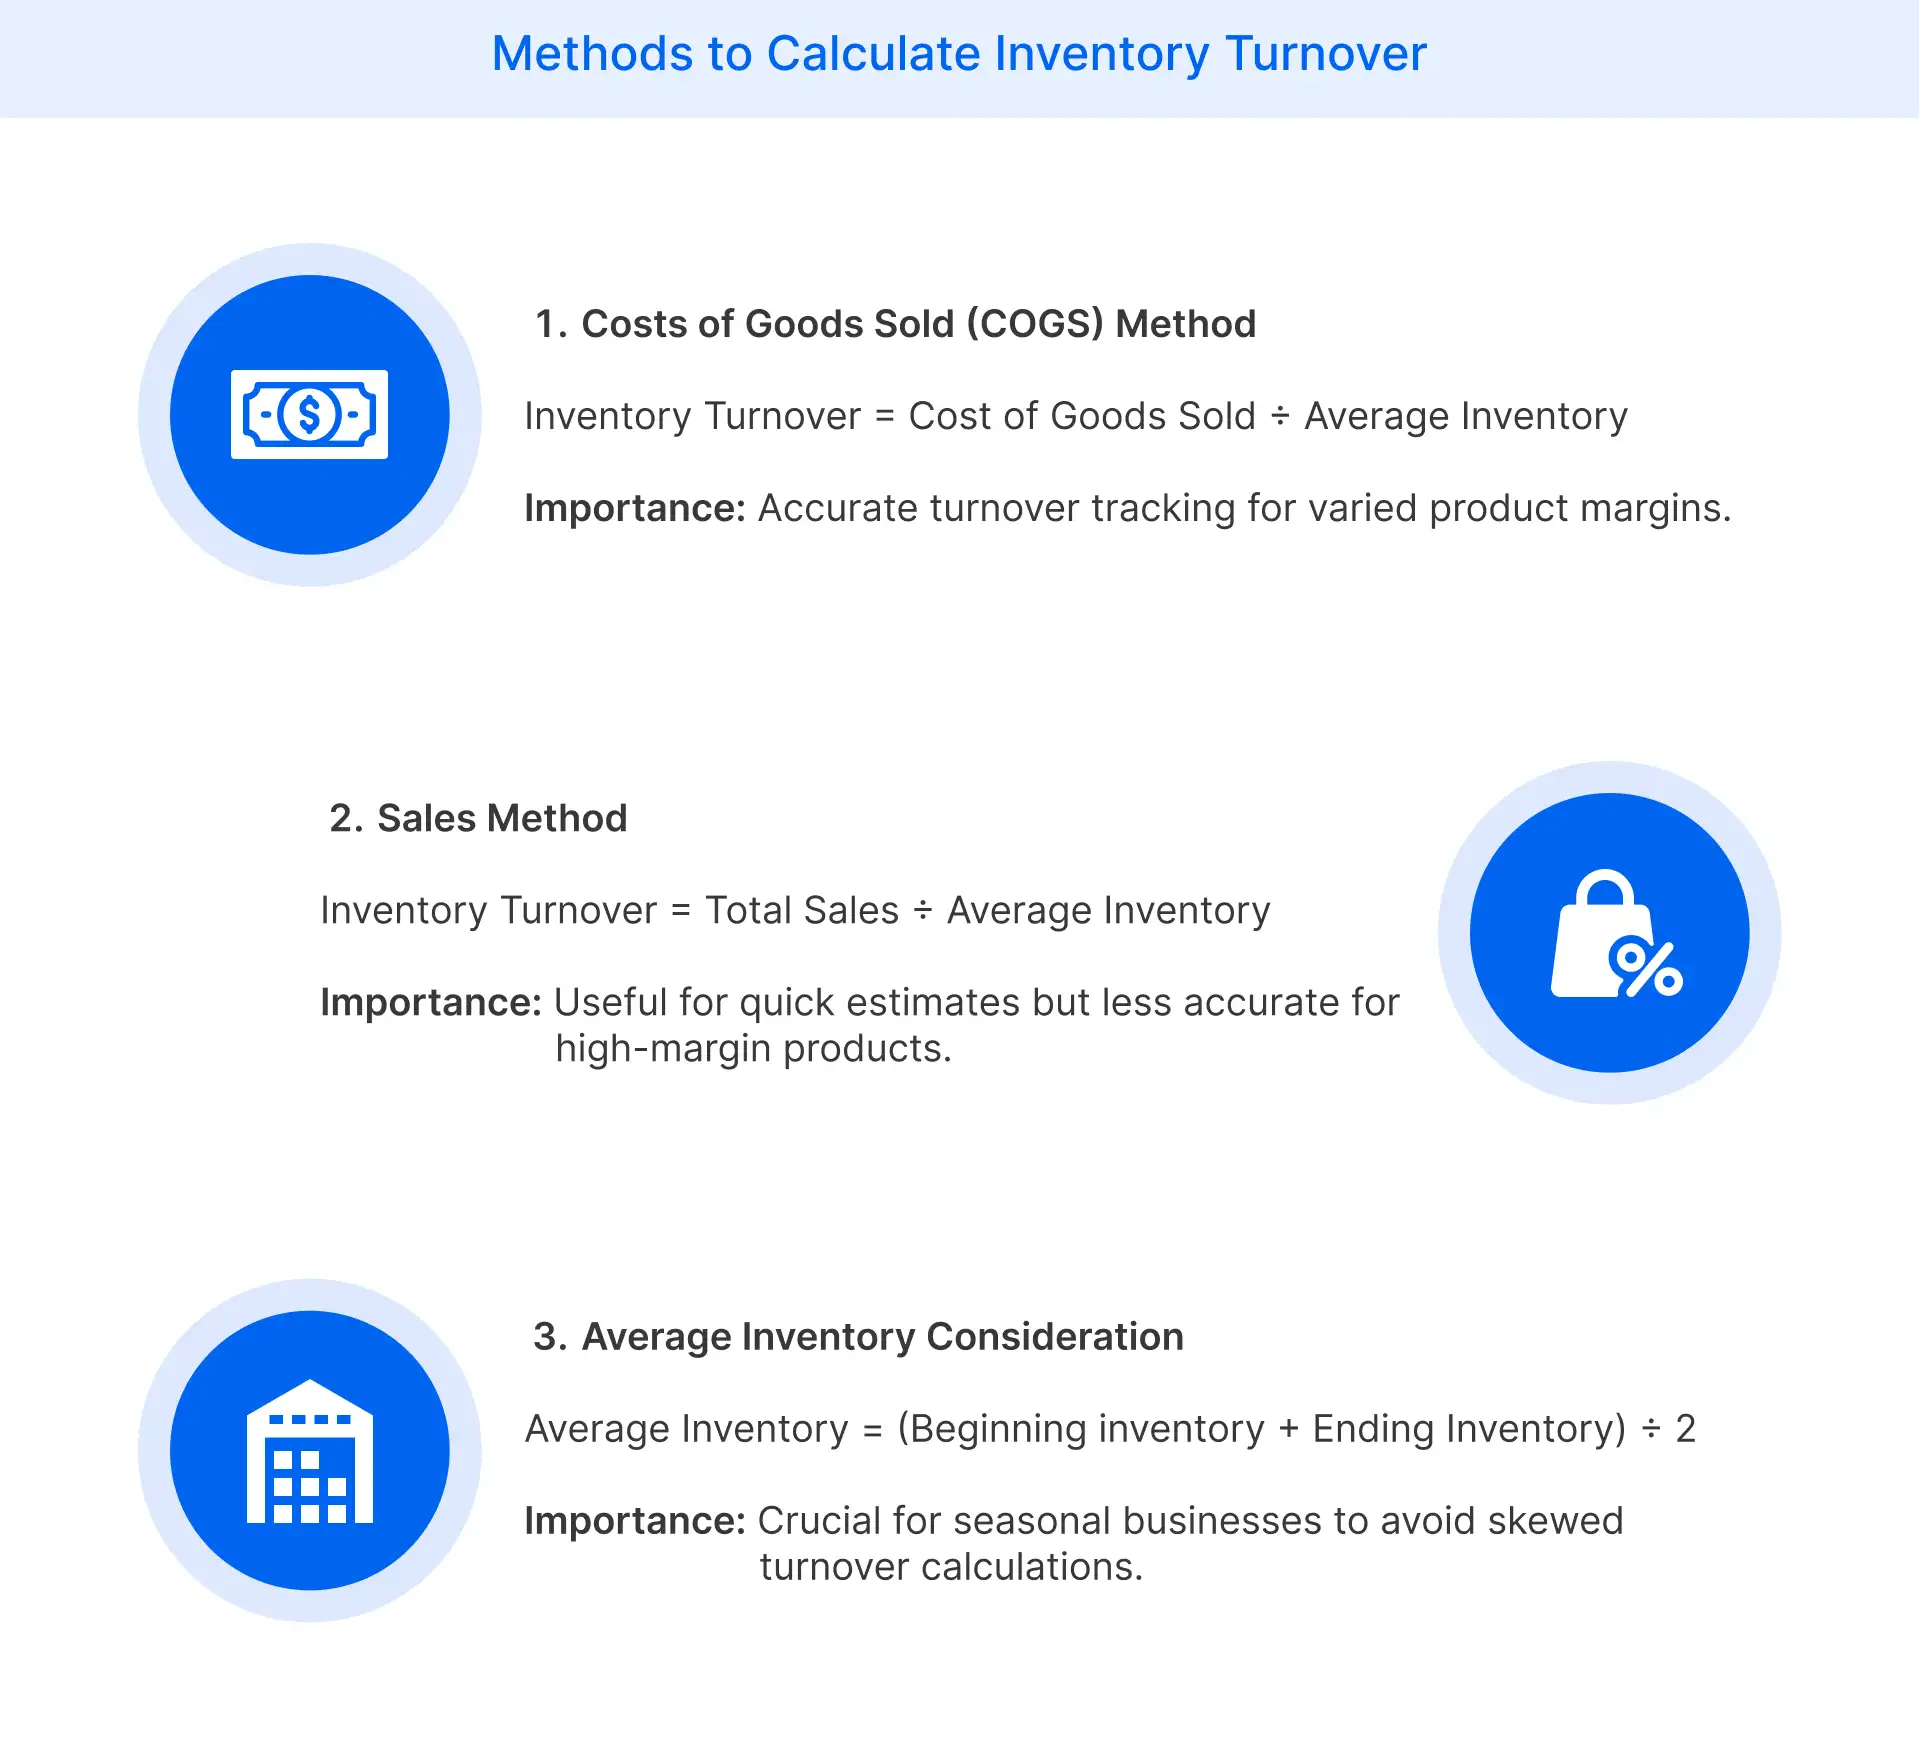
Sales Method
The Sales method offers a simpler alternative for calculating stock turnover, using total sales instead of COGS. While easier to compute, it can give a high inventory turnover ratio due to included profit margins.
Inventory Turnover = Total Sales / Average Inventory
This method is helpful for quick estimates or when COGS data is not readily available. However, it may overstate turnover for high-margin products.
Example: An online retailer has annual sales of $750,000 and an average inventory of $100,000. Their inventory turnover ratio using this method is 7.5, higher than the COGS method due to included profit margins.
Average Inventory Consideration
Using average inventory provides a more accurate representation of the amount of inventory levels throughout the year. This approach accounts for seasonal fluctuations and prevents skewed results from point-in-time inventory levels.
Average Inventory = (Beginning Inventory + Ending Inventory) / 2
This method is crucial for businesses with significant inventory variations, such as those in fashion or seasonal industries. It smooths out fluctuations for a more reliable turnover ratio.
Example: An e-commerce fashion store has a starting inventory of $90,000 and an ending inventory of $110,000. Their average inventory is $100,000, providing a more balanced figure for turnover calculations.
High vs. Low Inventory Turnover
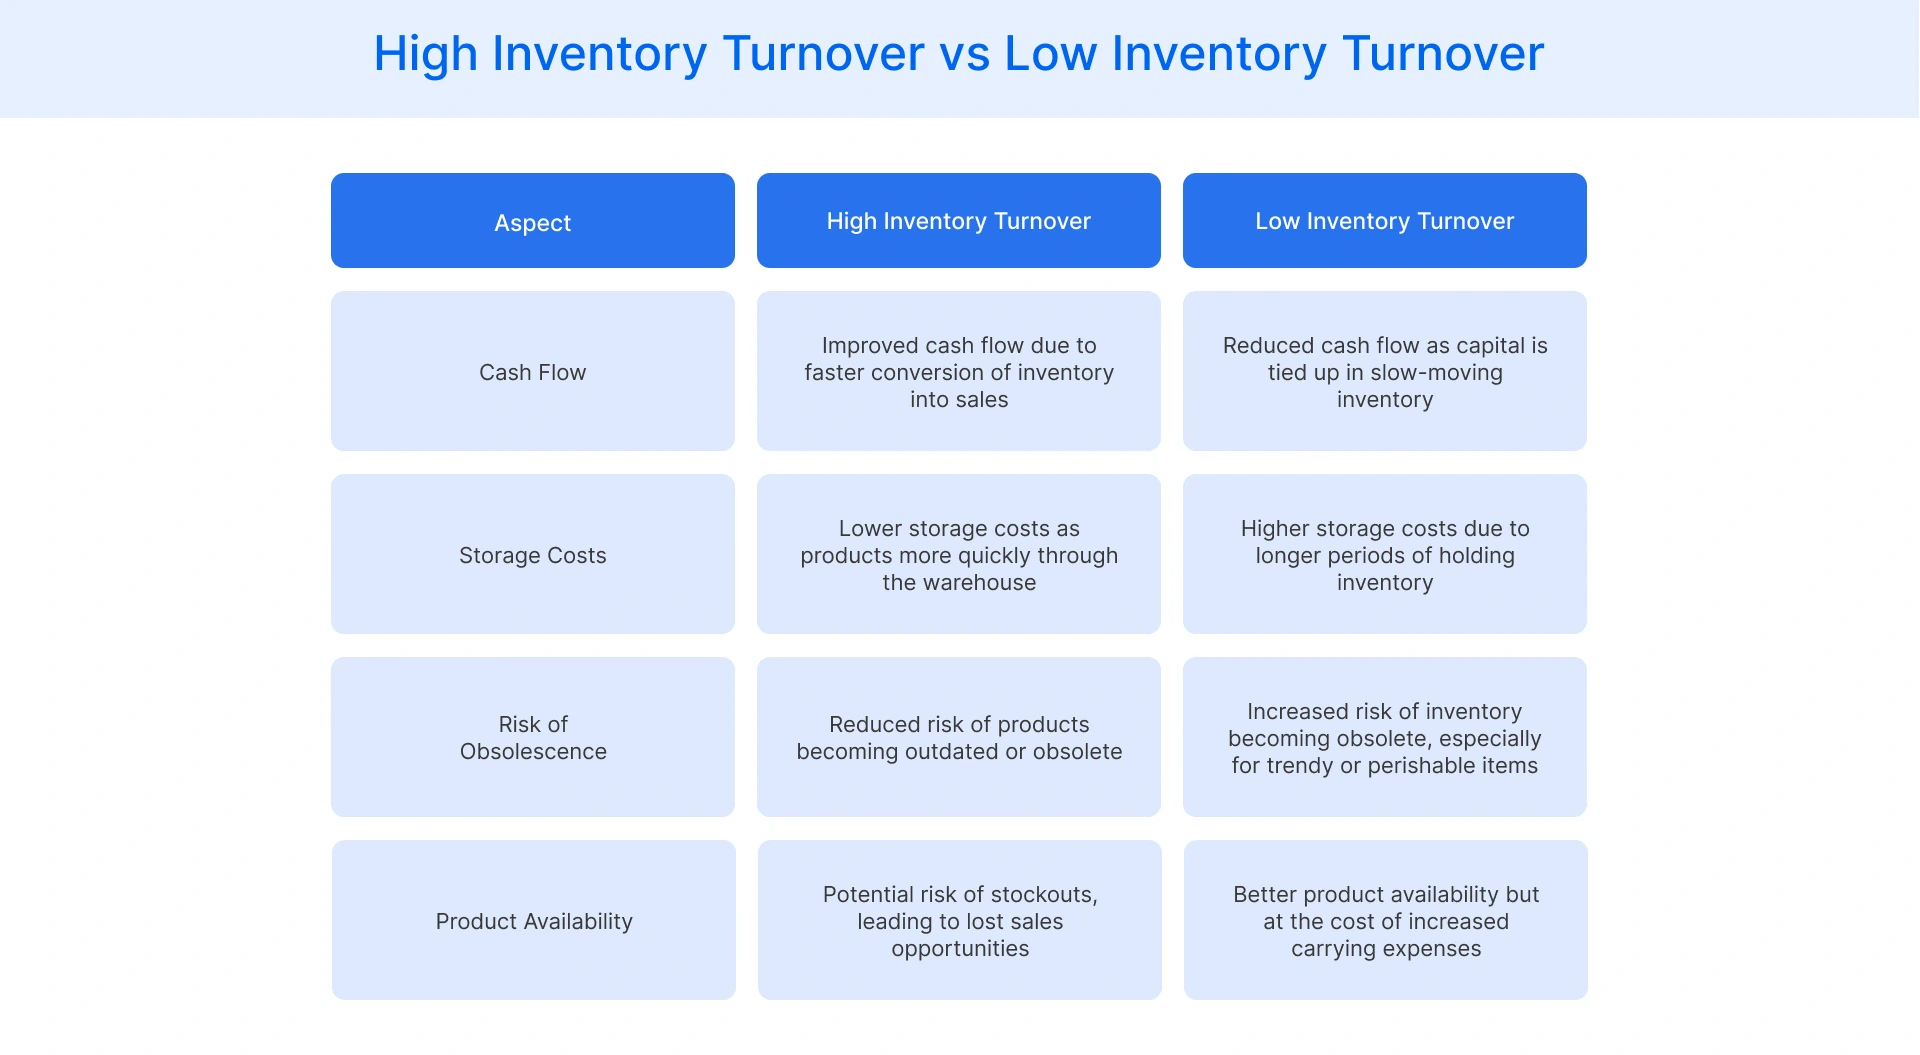
Inventory turnover rates provide crucial insights into a company's sales performance and inventory management efficiency. High and low turnover rates each have distinct implications for businesses.
A high inventory turnover rate typically indicates strong sales performance and efficient inventory management. It suggests that a company's products are in high demand and that it's effectively aligning supply with customer needs. This scenario often leads to improved cash flow, reduced storage costs, and minimized risk of obsolete inventory. However, an extremely high turnover rate might also signal potential stockouts, which could result in customer dissatisfaction and lost sales opportunities.
On the other hand, a low inventory turnover rate may indicate overstocking or weak sales performance. It could mean that a company's capital is tied up in slow-moving inventory, increasing carrying costs and the risk of obsolescence. This situation might arise from poor demand forecasting, ineffective marketing strategies, or misaligned pricing. However, in some instances, a low ratio is intentional, particularly for businesses dealing with high-value items or those prioritizing a wide product selection.
How to Improve Inventory Turnover?
Here are the different methods that can help improve inventory turnover:
Demand Forecasting
Accurate demand forecasting helps align inventory levels with real-time sales trends. It minimizes overstocking, reduces slow-moving items, and improves inventory turnover. Using data analytics and market insights ensures better purchase planning and stock allocation. Reliable forecasts support faster replenishment cycles, allowing businesses to maintain optimal stock levels without disrupting product availability or increasing excessive inventory.
Just-in-Time (JIT) Inventory
The JIT approach reduces excess stock by ordering inventory only when needed. It accelerates inventory turnover by keeping storage levels lean and responsive to actual demand. This method lowers warehousing costs and improves stock rotation. JIT also enhances supply chain flexibility, ensuring products are available without burdening the business with unsold inventory.
Supplier Relationship Management
Strong supplier relationships play a critical role in ensuring an ideal inventory turnover ratio. Reliable suppliers ensure timely deliveries, enabling faster restocking and better sales fulfillment. Collaborative planning reduces lead times and supports responsive inventory adjustments. Efficient supplier coordination helps businesses maintain continuity, reduce buffer stock, and respond quickly to demand changes without overloading storage space.
What is the relation between Inventory Turnover and Cash Conversion Cycle?
Inventory Turnover and the Cash Conversion Cycle (CCC) are closely interrelated metrics that play crucial roles in a company's financial management. Understanding their relationship can provide valuable insights into a business's operational efficiency and liquidity.
Inventory Turnover is a key component of the Cash Conversion Cycle. The CCC measures the time it takes for a company to convert its investments in inventory and other resources into cash flows from sales. It consists of three main elements: Days Inventory Outstanding (DIO), Days Sales Outstanding (DSO), and Days Payables Outstanding (DPO).
The formula for the Cash Conversion Cycle is:
CCC = DIO + DSO - DPO
Inventory Turnover directly impacts the Days Inventory Outstanding (DIO) component of the CCC. DIO represents the average number of days a company holds its inventory before selling it. It is calculated as:
DIO = (Average Inventory / Cost of Goods Sold) × 365
A higher Inventory Turnover ratio leads to a lower DIO, which in turn results in a shorter Cash Conversion Cycle. This relationship demonstrates that efficient inventory management can significantly improve a company's cash flow and working capital position.
For example, if a company improves its inventory turnover from 4 to 6 times per year, it will sell more quickly. This reduction in inventory holding time period decreases the DIO, subsequently shortening the overall Cash Conversion Cycle.
Manage your inventory effortlessly with FCC
At Flipkart Commerce Cloud (FCC), we empower you to streamline your retail inventory management system and boost inventory turnover seamlessly. Our latest tech-driven solutions provide real-time insights, helping you monitor stock levels and respond to demand shifts instantly.
With our supply chain management tools, you can predict trends accurately, preventing overstocking and stockouts effectively. Our composable commerce stack integrates warehousing technology, enabling you to manage stock across multiple channels effortlessly. You gain visibility into inventory movement, ensuring products stay fresh, and capital flows freely.
We also offer advanced analytics to track inventory turnover so you can optimize purchasing and reduce holding costs confidently. Retailers worldwide trust our scale-tested platform to enhance operational efficiency and profitability.

FAQ
There is an inverse relationship between inventory turnover and stock-outs. While a high turnover rate is generally positive, an extremely high rate might lead to frequent stock-outs if not appropriately managed. Balancing high turnover with adequate safety stock is crucial to avoid lost sales and maintain customer satisfaction.
Seasonality significantly affects inventory turnover, especially in industries like fashion or holiday-related products. During peak seasons, turnover may increase dramatically, while off-seasons might see lower rates. Using average inventory in calculations helps smooth out these fluctuations.
A good inventory turnover ratio for e-commerce businesses typically ranges from 4 to 8 times per year. However, this can vary depending on the product type and industry. Fast-moving consumer goods may have higher ratios, while specialty or luxury items may have lower turnover rates.
Inventory turnover should be calculated regularly, typically monthly or quarterly, to track trends and make timely adjustments. Annual calculations provide a broader view but may miss short-term fluctuations. The frequency can vary based on your business type, with fast-moving consumer goods requiring more frequent analysis than slow-moving items.